


Once you have a reasonable suite of unit tests, you might start to wonder how much of your code is properly tested. Measuring coverage gives one perspective, and it’s one we can easily add to our builds.
OpenCover is an open-source code coverage tool with a convenient command-line interface that we can easily leverage with Psake.
As we have previously, our starting point is working out how to run the command manually:
PS> .\packages\OpenCover.4.6.519\tools\OpenCover.Console.exe
    -target: .\packages\xunit.runner.console.2.2.0\tools\xunit.console.exe
    -targetargs: ".\build\Niche.CommandLine.Tests\Debug\Niche.CommandLine.Tests.dll
        -xml .\build\testing.results\Niche.CommandLine.Tests.xunit.xml
        -html .\build\testing.results\Niche.CommandLine.Tests.xunit.html"
    -targetdir: .\build\Niche.CommandLine.Tests\Debug
    -register: user
    -output: .\build\testing.results\Niche.CommandLine.Tests.opencover.xml
    -filter: +[Niche.*]* -[*Tests]*
(This is quite a mouthful of a command line, so the options are wrapped for readability; if you’re trying this out for yourself, they all need to be on the same line.)
Let’s breakdown the options one by one.
-target: specifies the application to run, in this case, the xUnit console runner for our unit test suite, xunit.console.exe.
-targetargs: defines the arguments to pass to the xUnit console runner. Note the (very easily missed) double quotes here - the -xml and -html options (shown above with an extra indent) are a part of the arguments for xunit.console.exe and therefore part of this string.
-targetdir: specifies the folder where our test assemblies are found; this is needed so that OpenCover knows where to load the required .pdb files. Without this, I find the coverage report shows no coverage at all.
-register: user is needed to activate the profiler if running in an unelevated (non-administrator) mode. Without this, OpenCover needs to be pre-registered via regsvr32.
-output: specifies an output folder for the results of the coverage analysis.
-filter: restricts the reporting to only the assemblies that make up our project; the +[Niche.*]* includes all classes from assemblies starting with Niche.; while -[*Tests]* excludes all our test assemblies.
To set up our build script, we’ll to install OpenCover (via NuGet) and then write a task to find the executable:
Task Requires.OpenCover {

    $script:opencoverExe =
        resolve-path ".\packages\OpenCover.*\tools\OpenCover.Console.exe"

    if ($opencoverExe -eq $null)
    {
        throw "Failed to find opencover.console.exe"
    }

    Write-Host "Found OpenCover here: $opencoverExe"
}
Then we can write the task itself:
Task Coverage.Tests -Depends Requires.OpenCover, Requires.XUnitConsole,
    Configure.TestResultsFolder, Compile.Assembly {

    $testFolder = resolve-path "$buildDir\Niche.CommandLine.Tests\$buildType"
    $xmlOutput = join-path $testResultsFolder "Niche.CommandLine.Tests.xunit.xml"
    $htmlOutput = join-path $testResultsFolder "Niche.CommandLine.Tests.xunit.html"
    $coverageOutput =
        join-path $testResultsFolder "Niche.CommandLine.Tests.opencover.xml"

    exec {
        write-host $opencoverExe -target:"$xunitExe"
            -targetargs:"$testFolder\Niche.CommandLine.Tests.dll
            -xml $xmlOutput -html $htmlOutput"
            -targetdir:"$testFolder" -register:user
            -output:"$coverageOutput" -filter:"+[Niche.*]* -[*Tests]*"
    }
}
Lastly, we need to hook it into our continuous integration build:
Task CI.Build -Depends Debug.Build, Generate.Version, Compile.Assembly, Coverage.Tests
When we run ci-build.ps1, the output will now include the results of the coverage run:
----------------------------------------------------------------------
Coverage.Tests
----------------------------------------------------------------------
Executing: C:\GitHub\Niche.CommandLineProcessor\packages\xunit.runner.console.2.2.0\tools\xunit.console.exe
xUnit.net Console Runner (64-bit .NET 4.0.30319.42000)
  Discovering: Niche.CommandLine.Tests
  Discovered:  Niche.CommandLine.Tests
  Starting:    Niche.CommandLine.Tests
  Finished:    Niche.CommandLine.Tests
=== TEST EXECUTION SUMMARY ===
   Niche.CommandLine.Tests  Total: 159, Errors: 0, Failed: 0, Skipped: 0, Time: 0.767s
Committing...
Visited Classes 24 of 26 (92.31)
Visited Methods 104 of 109 (95.41)
Visited Points 635 of 671 (94.63)
Visited Branches 252 of 267 (94.38)

==== Alternative Results (includes all methods including those without corresponding source) ====
Alternative Visited Classes 30 of 32 (93.75)
Alternative Visited Methods 143 of 185 (77.3)
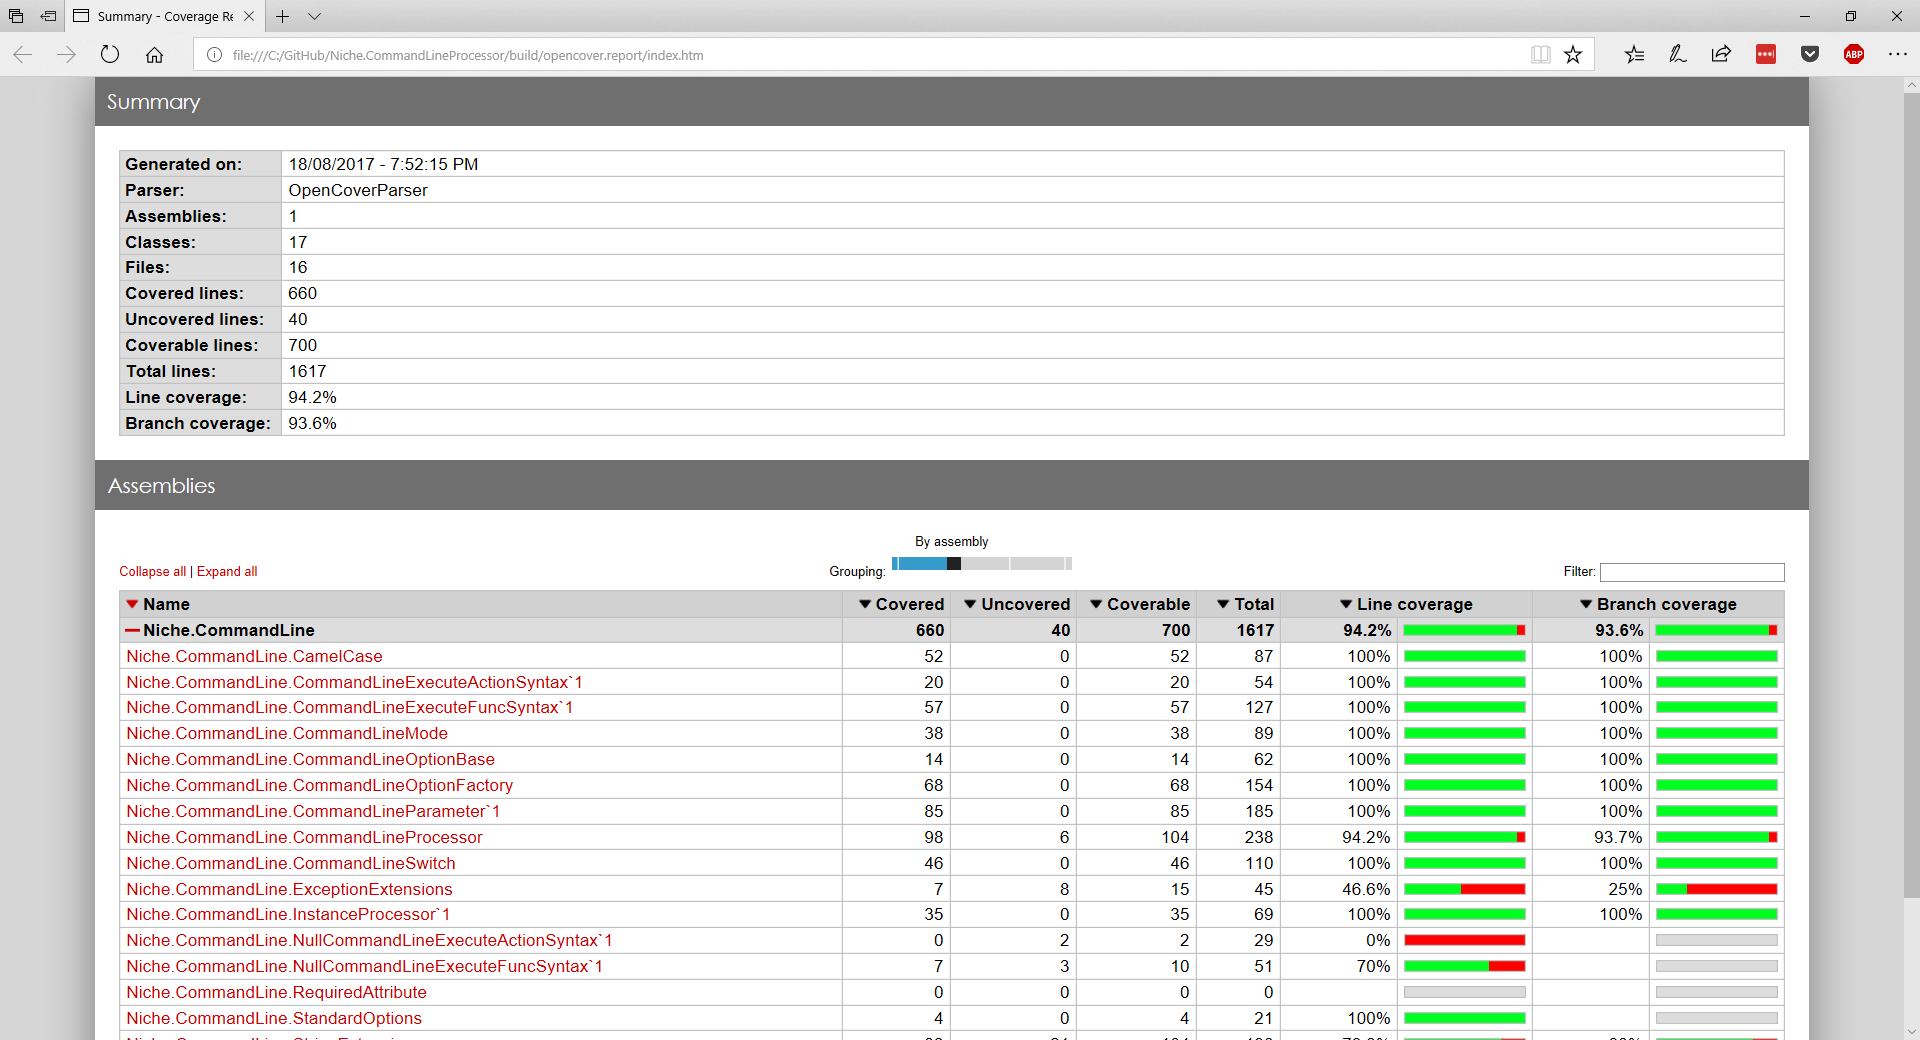
This is somewhat informative - but fortunately, there’s a lot more information available. We can see details of coverage down to the individual line of code. Next time we’ll see how to generate an HTML coverage report like this one:
Comments
blog comments powered by Disqus