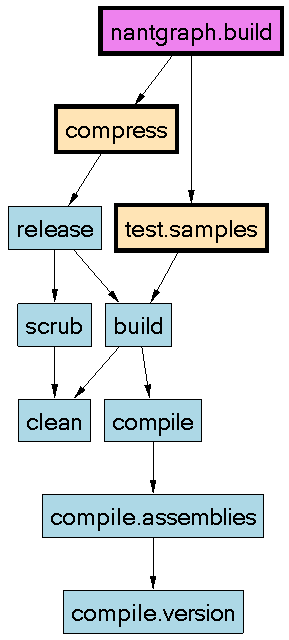
NAntGraph is a documentation tool designed to make it easier to understand NAnt or Ant build files. Based on GraphViz, NAntGraph depicts the structure of your build file targets and their dependencies as a directed graph.
 A common proverb reads A picture is worth a thousand words. In the
computer field, we often find that one diagram is worth a thousand lines of code - or more. In fact, a good diagram can
make it much easier to understand the code - providing an easy entry point through which a
reader may gain a high level understanding before approaching the code itself.
For example, shown to the right is the structure of NAntGraph’s own NAnt build file.
From this diagram, it’s easy to see the available targets and their dependencies, making it easier to understand the build file as a whole.
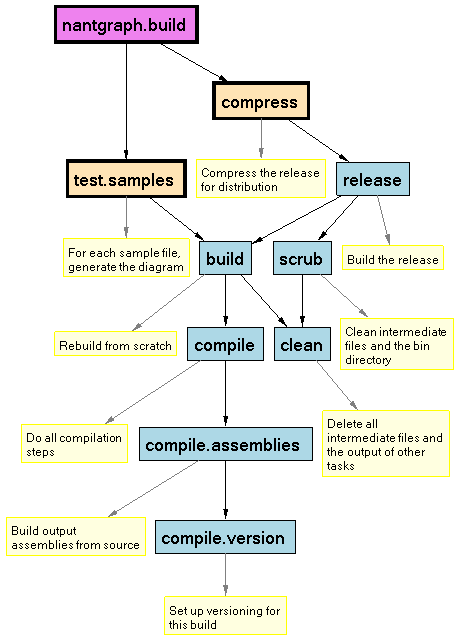
If useful, the description elements from targets can be included to provide additional detail:

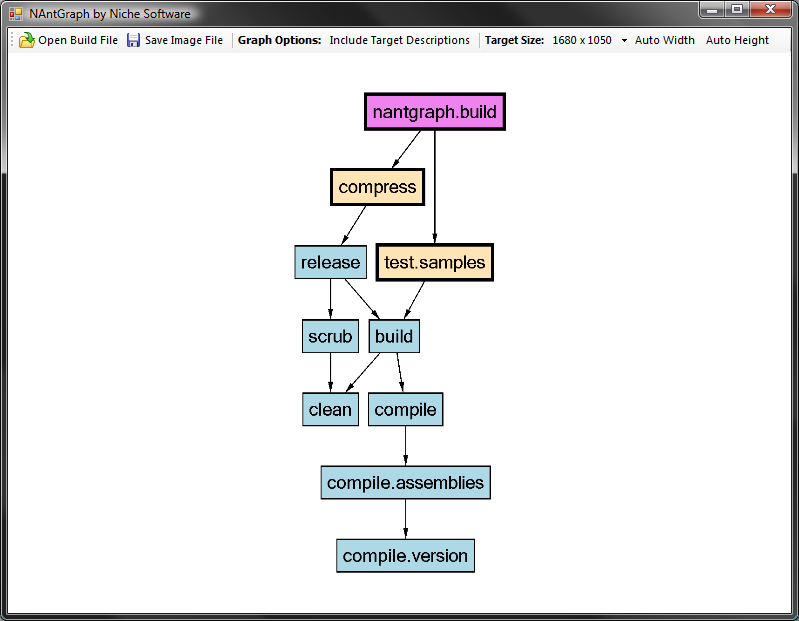
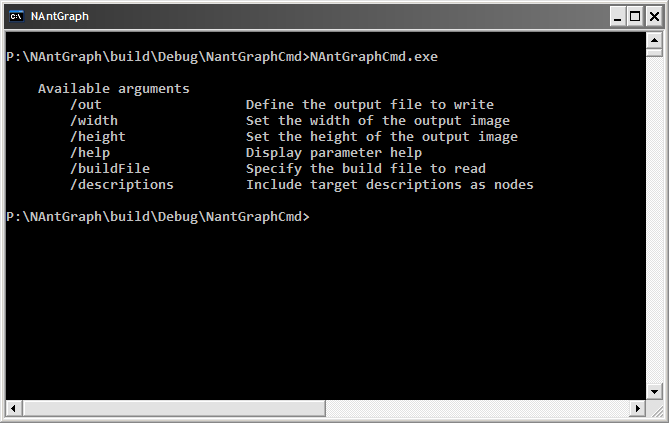
NAntGraph consistes of two separate programs - a graphical UI (NAntGraphUI) that allows you to create the graphs
interactively, and a commandline version (NAntGraph2), designed for integration into your build process.


Note: From NAntGraph2, released March 2010, the external tool used to render the graphs has changed from Microsoft’s GLEE tool to GraphViz. Why the change? GLEE has been commercialized by Microsoft and is no longer available at no charge; GraphViz is open source, and had I known about it at the time, is likely to have been the tool I originally used.


