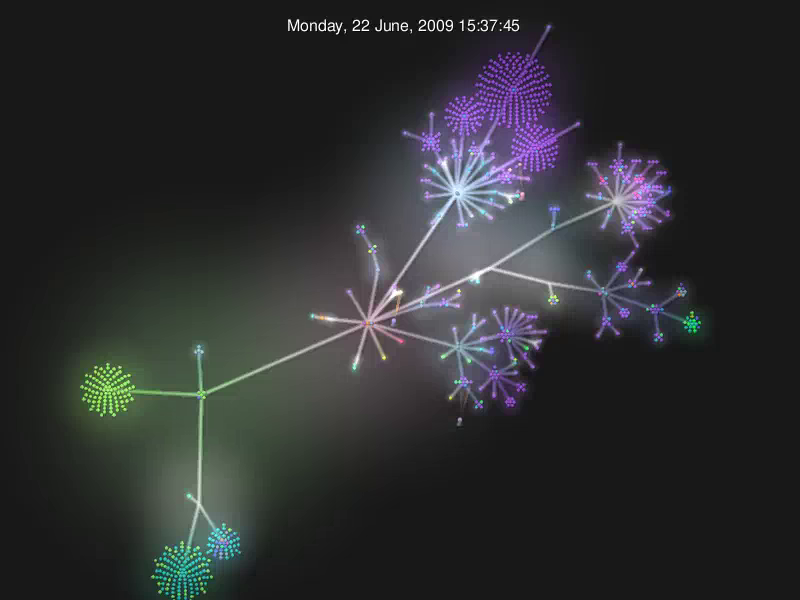
At this weeks .NET user group, a friend mentioned Gource, a tool that generates a dynamic visualization that shows how a project evolves over time, based on the commits made to source control.
After finding one movie on the Xero blog, I decided to have a go and see what it looked like when run over a large project I’ve worked on for the last couple of years.
It looks gorgeous:

Seeing the evolution of the project over time with Gource provides a new way to look at what we built - not to mention being a crowd puller around my desk.
If you have some time to play, grab Gource and try it out.


