As a metaphor, Technical Debt gives us a useful way to think about certain problems. How can we now try to measure it and ensure that we are improving things, not making them worse?
It would be nice if there was a straightforward way to measure Technical Debt - to automatically compute some kind of number that quantified our level of indebtedness, and which in turn guided us towards a perfect codebase.
Unfortunately, here in the real world the popularly embraced management meme “if you can’t measure it, you can’t manage it” has been thoroughly discredited simply because the things we really value - such as customer satisfaction, staff morale, developer productivity and code quality - can’t be directly measured.
Instead we need to choose a number of good quality measures - often referred to as Key Performance Indicators (KPIs) in management speak - to track and interpret. Understanding the limitations of each KPI is vital as each will only portray a limited perspective.
Here is one metric that you may want to use - it certainly isn’t the only possible metric and must not be used in isolation. That said, as one data point for decision making, I believe this has merit.
The Maintainability Metric
Since Visual Studio 2010, there has been a maintainability metric that tries to measure how easy it might be for a new developer to come along and understand the code.
Measured on a scale from 100 (perfectly maintainable) to 0 (disastrous), the metric combines three measures into a single number:
Lines of Code - a simple measure of the number of statements in the method, with the view that longer code is less maintainable.
Cyclomatic Complexity - perhaps one of the most famous code metrics, this counts the number of distinct execution paths through code. More complex methods are harder to understand and therefore are less maintainable.
Halstead Volume - itself a composite measure, this is effectively a measure of the vocabulary required to reason about the code. Even short methods can be hard to understand if a wide variety of concepts needs to be grasped.
While the metric itself hasn’t changed, thoughts on appropriate thresholds have - in the latest version of the Visual Studio Code Lens Health indicator, above 60 is considered good, 20 to 60 merits a warning and below 20 is getting dangerous.
Scaling Up
To automate the production of this metric, the Visual Studio team has made available the Visual Studio Code Metrics Powertool, a command line tool.
For Visual Studio 2010 (requires Premium or Ultimate editions) download the Visual Studio Code Metrics PowerTool 10.0.
For Visual Studio 2012 (requires Professional, Premium or Ultimate editions) download the Visual Studio Code Metrics PowerTool 11.0
For Visual Studio 2013 (requires Professional, Premium or Ultimate editions) download Visual Studio Code Metrics Powertool for Visual Studio 2013.
For Visual Studio 2015 (requires Community, Professional or Enterprise editions) download Visual Studio Code Metrics Powertool for Visual Studio 2015.
Make sure you download the version that matches your copy of Visual Studio - and make a note that you’ll need to download a different version if/when you upgrade to the next version.
An aside - it’s nice to see that features like this are becoming available to lower (less expensive) editions of Visual Studio over time.
Using PowerShell
Now that we have the command line version of the tool, we can calculate the maintainability metric across an entire project in one hit - here’s how to do this in PowerShell.
To begin, we locate the tool itself and store the location for later use:
$metricsExe = resolve-path "C:\Program Files (x86)\Microsoft Visual Studio 14.0\Team Tools\Static Analysis Tools\FxCop\metrics.exe"

# Write the path found so it's logged during the build
Write-Host "Found $metricsExe"
This is the location for the Visual Studio 2015 version of the tool and will need adjustment if you are using an earlier version.
Next we run the tool for each of the assemblies on which we want to report:
$metricsResultFolder = join-path $buildDir metrics
$quiet = mkdir $metricsResultFolder -erroraction silentlycontinue

$dlls = ( join-path $buildDir "\Document.Factory.Core\Debug\Document.Factory.Core.dll"),
        ( join-path $buildDir "\Document.Factory.Features\Debug\Document.Factory.Features.dll"),
        ( join-path $buildDir "\Document.Factory.Visuals\Debug\Document.Factory.Visuals.dll"),
        ( join-path $buildDir "\Document.Factory.Windows\Debug\Document.Factory.Windows.dll"),
        ( join-path $buildDir "\dfcmd\Debug\dfcmd.exe")

remove-item $metricsResultFolder\*.metrics.xml

foreach($file in $dlls) {
	Write-Step "Processing $file"
	Write-Host
	$fileName = [System.IO.Path]::GetFileName($file)
	& $metricsExe /file:$file /out:$metricsResultFolder\$fileName.metrics.xml
	Write-Host
}
The variable $buildDir is a reference the output folder into which all the projects compile -
you’ll need to define this appropriately for your environment.
Note that the analysis of each assembly is written into a file with the suffix .metrics.xml -
this makes it easier to find those files later on.
Generating a Chart
Now that our analysis is complete, what do we do with all this data? I’ve found it useful to generate a histogram that shows the distribution of the maintainability metric across my code.
Let’s define a PowerShell function that will load the results of the previous analysis and will build the data we require to build the histogram:
function Load-Metrics {
    param($file, $metrics)

    $metricsFile = [xml](get-content $file)

    $count = 0
    if ($metricsFile -ne $null)
    {
        foreach($m in $metricsFile.SelectNodes("//Member"))
        {
            $name = $m.Name
            $node = $m.SelectSingleNode("./Metrics/Metric[ @Name = 'MaintainabilityIndex' ]")
            if ($node -ne $null)
            {
                $index = [int]($node.Value)

                $metrics[$index] = $metrics[$index] + 1
                $count++
            }
        }
    }

    Write-Debug $count
}
For this to work, we need a helper function to create an empty set of metrics into which we can load data:
function New-Metrics {

    $metrics = @{}
    for($index = 0; $index -le 100; $index++)
    {
        $metrics[$index] = 0
    }

    return $metrics
}
With those functions in place, we can now write a loop to load in all the metrics for all the assemblies we previously processed:
$metrics = New-Metrics
foreach($file in (get-childitem -Path $metricsResultFolder *.metrics.xml -recurse))
{
    Write-Step $file.Name
    Load-Metrics $file.FullName $metrics
}
And finally, to generate the histogram itself - fortunately there is support for Charting built into the .NET framework and we can do this without acquiring an outside dependency:
# chart object
$chart = New-object System.Windows.Forms.DataVisualization.Charting.Chart
$chart.Width = 1600
$chart.Height = 900
$chart.BackColor = [System.Drawing.Color]::White

# chart area
$chartarea = New-Object System.Windows.Forms.DataVisualization.Charting.ChartArea
$chartarea.Name = "ChartArea"

# X axis
$chartarea.AxisX.Title = "Document.Factory Maintainability"
$chartarea.AxisX.TitleFont =  New-Object System.Drawing.Font("Calibri", 16,[System.Drawing.Fontstyle]::Bold)
$chartarea.AxisX.Minimum = 0
$chartarea.AxisX.Interval = 10
$chartarea.AxisX.Maximum = 101

# Y axis
$chartarea.AxisY.Title = "Count"
#$chartarea.AxisY.Interval = 25
#$chartarea.AxisY.IsLogarithmic = $true
$chart.ChartAreas.Add($chartarea)

# data series
$series = $chart.Series.Add("Metrics")
$total = 0
$count = 0
for($index = 0; $index -le 100; $index++)
{
	if ($metrics[$index] -ne 0)
	{
		$pointIndex = $series.Points.AddXY( $index, $metrics[$index] )
		$point = $series.Points[$pointIndex]
		$total = $total + $metrics[$index]
		$count++
		$point.Color = Select-Color $index
	}
}

# Uncomment this to truncate tall columns
#$chartarea.AxisY.Maximum = [int]( $total / $count)

# save chart
$chartFile = join-path $buildDir "metrics\Document.Factor.Metrics.png"

$chart.SaveImage($chartFile, "png")
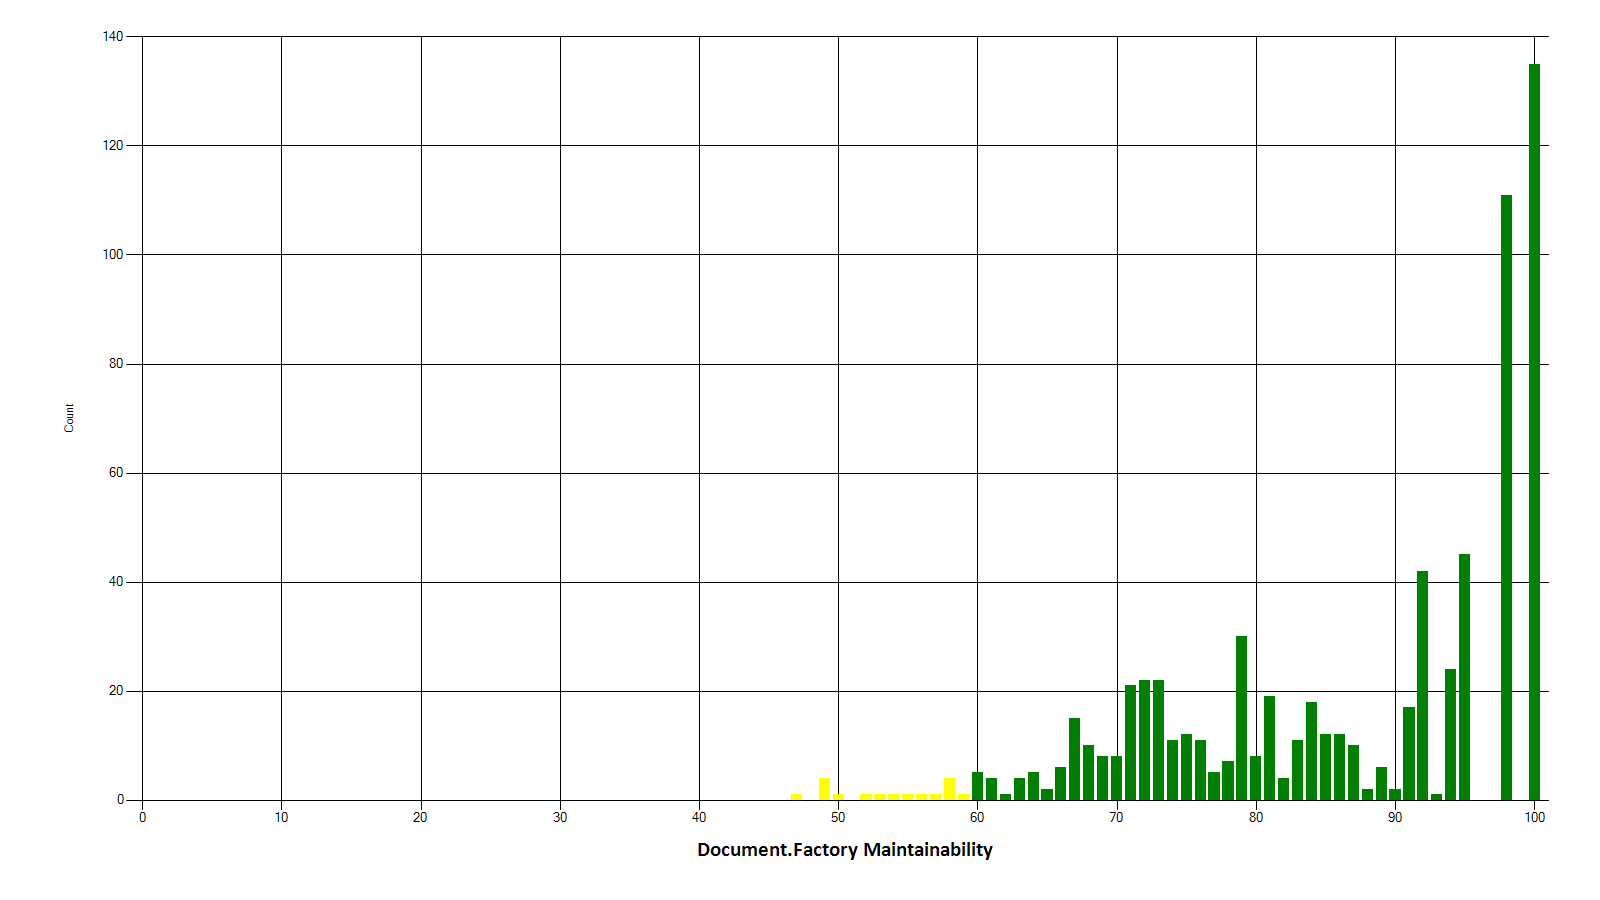
The result? A chart like this:

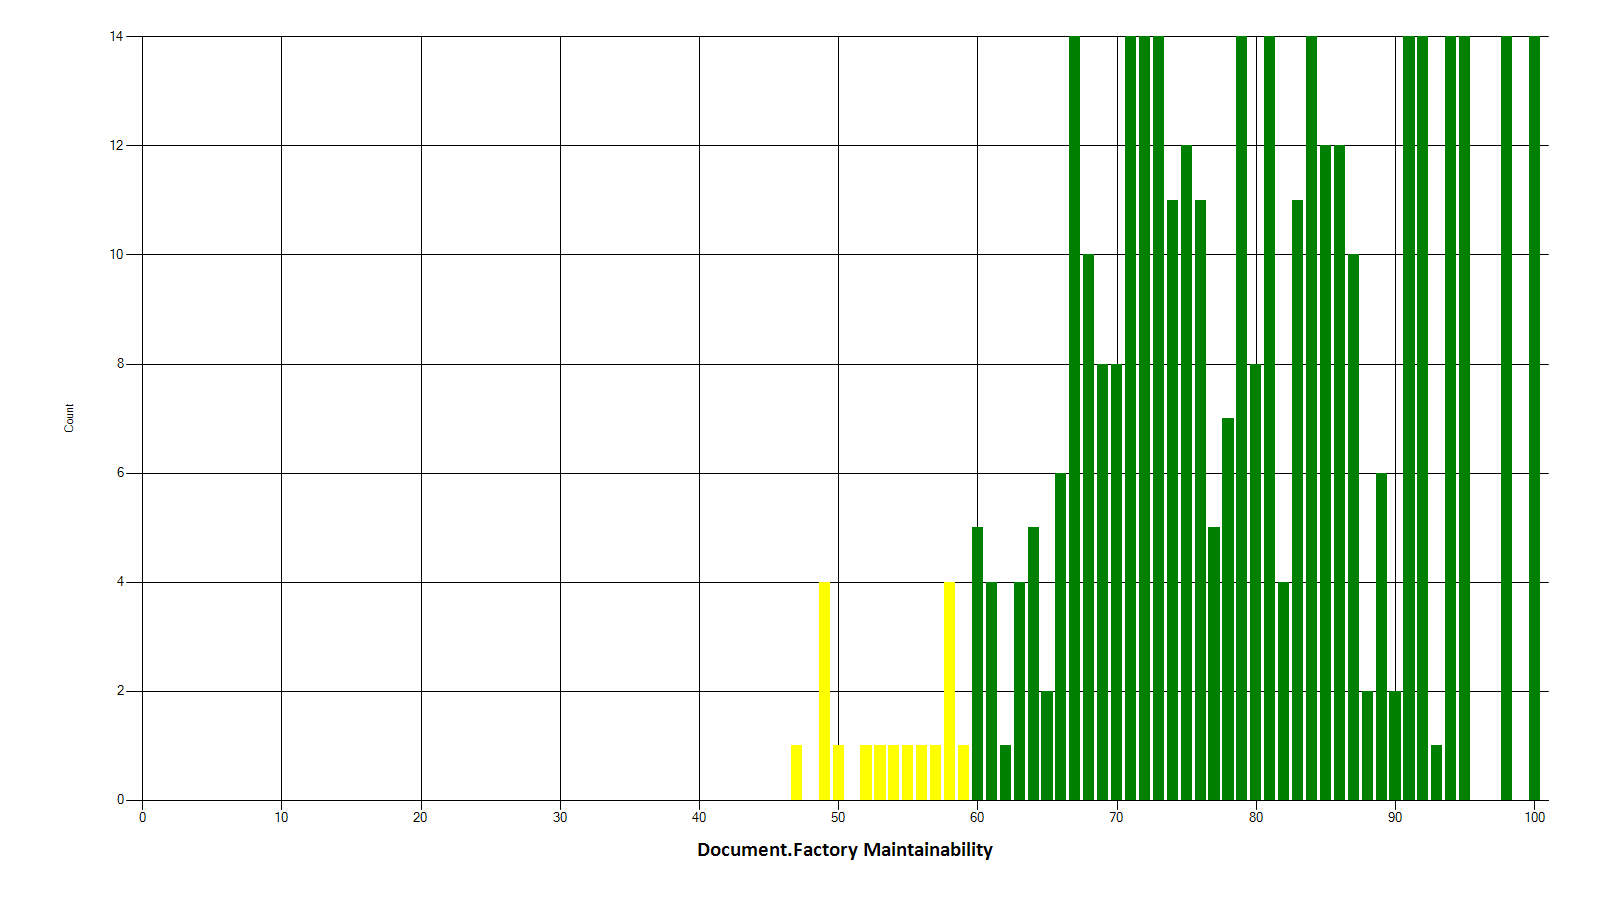
This graph is based on a personal project where I’ve been paying attention to the maintainability metric as I work, so you can see both the heavy weighting towards the righthand side of the chart and the low number of methods on the left where the maintainability metric is lower.
If you want to focus on the details around the lower levels of maintainability, add this line after populating the chart:
$chartarea.AxisY.Maximum = [int]( $total / $count)
Comparing one version of this chart with another will show you how your code is changing over time - are you introducing technical debt by increasing the number of “unmaintainable” methods, or are things getting better over time?
What next?
There are other ways to do something similar …
… the popular tool JetBrains Resharper has a free Resharper Command Line Tool - you could use this to calculate a Resharper Warning Density metric for each file (number of Resharper warnings divided by the length of the file) and graph that over time.
… or calculate a Code Analysis Density using the Visual Studio Code Analysis tools that come out of the box, perhaps enhanced by the open source Refactoring Essentials project.
How are you measuring Technical Debt, if at all? Is this working for you? Are you doing enough or do you need to improve?


Comments
blog comments powered by Disqus