Test coverage isn’t a perfect metric, but it is a useful one, and I’ve found that the OpenCover project is a useful way to keep an eye on code coverage in my own projects.
With OpenCover, I can easily run my test suite (see details below) and generate a report (using ReportGenerator) that shows me what code has been tested, and what code has not.

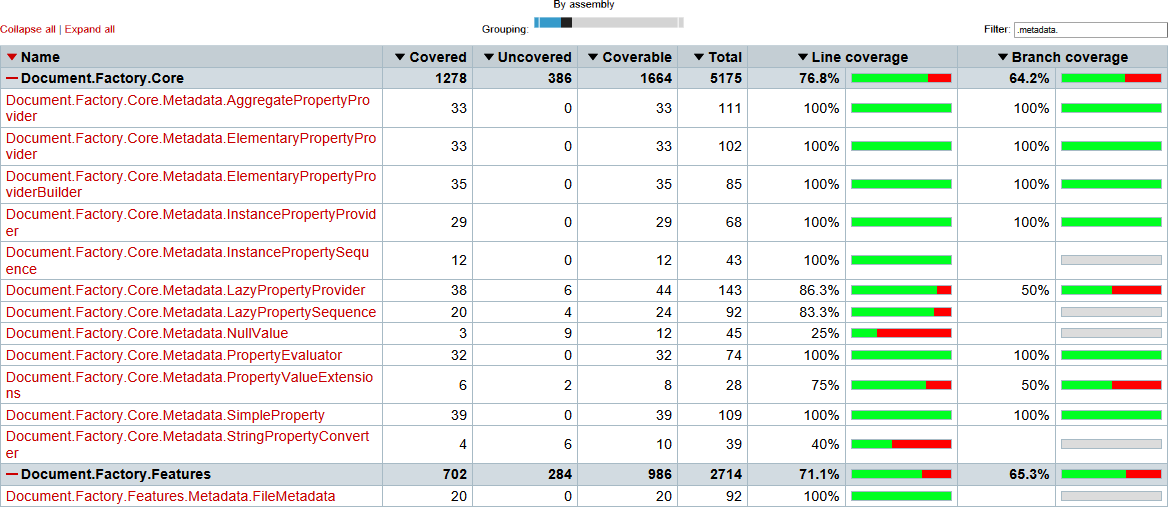
As you can see in this screen capture, coverage of the metadata subsystem in my Document.Factory project is pretty good, but it has some notable gaps. The most obvious is the NullValue class, with pratically no coverage at all (though it is only 12 lines). More important is the LazyPropertyProvider where half of the branches are untested.
Aside: The value of test coverage is somewhat contested. Some (rightly) point out that a simple coverage metric tells you nothing about the quality of the tests. However, the 76.8% coverage value in the above screenshot tells me something very important: 23.2% of the code is not tested at all.
Getting Started
After adding the OpenCover NuGet package to my project, my next step was to work out the appropriate command line parameters. It turns out that these fall into two distinct groups: parameters for defining the program to run, and parameters to control what OpenCover does.
I’m using xUnit for my unit tests, so the command for running the tests in one assembly is pretty simple:
xunit.console.exe Document.Factory.Core.Tests.dll
    -xml Document.Factory.Core.Tests.xunit.xml
The -xml parameter specifies the output file to use for the test results.
OpenCover uses three distinct parameters: one for the application to run, one for the parameters the application needs, and one for the folder in which the application should be executed. For my xunit tests, these are:
-target:xunit.console.exe
-targetargs:"Document.Factory.Core.Tests.dll -xml Document.Factory.Core.Tests.xunit.xml"
-targetdir:C:\...\build\Document.Factory.Core.Tests\Debug
OpenCover supports the use of quotes for when filenames or paths contain spaces but does not require their use.
To control the behavior of OpenCover itself, I used the following parameters:
-register:user registers OpenCover as a profiler with the .NET framework. Using this means that the profiler does not need to run as an administrator.
-filter:+[Document.*]* -[*.Tests]* -[*.IntegrationTests]* limits the results to only the assemblies that make up my application (which all start with Document) and excludes my test assemblies (which all end with .Tests or .IntegrationTests).
-output:Document.Factory.Core.Tests.coverage.xml specifies the output file for the coverage results.
All filenames shown here are for demonstration - the actual values used in my build script are fully qualified paths.
Automation with Psake
Once I’d confirmed the parameters were correct for direct use, I then integrated OpenCover into my build system, based on Psake.
To begin, a simple Task to find the console executable - using resolve-path with a wildcard means that it will find whatever version is present, even if/when the package is upgraded by NuGet.
Task Require.OpenCover {
    $script:openCoverExe
        = resolve-path .\packages\OpenCover.*\tools\OpenCover.Console.exe
    Write-Detail "Found $openCoverExe"
}
This task mirrors an existing one called Require.xUnit that locates the xUnit console executable.
Upgrading my existing Test.xUnit Task to use OpenCover with xUnit, the task now looks like this:
Task Test.xUnit
    -Depends Require.xUnit.Console,
        Require.BuildType,
        Require.OpenCover,
        Compile.Exe
{
    // ... elided ...
    foreach($test in (
        get-childitem
            -Path $baseDir\build\*\$buildType Document.*Tests.dll
            -recurse))
    {
        // ... elided ...
        & $openCoverExe
            -target:"$xUnitExe"
            -targetargs:"$test -xml $xmlOutput -html $htmlOutput"
            -targetdir:"$testFolder"
            -register:user
            -filter:"+[Document.*]* -[*.Tests]* -[*.IntegrationTests]*"
            -output:"$coverageOutput"
        // ... elided ...
    }
}
Be aware that I’ve removed a lot of extraneous detail around logging and error management/recover from the example to keep it focussed on OpenCover. This code is not suitable for reuse without significant modification.
Reporting
Generating the coverage data is one thing, making it readable and useful is another. OpenCover does nothing directly here; the developer has expressly chosen to work on the coverage problem, leaving reporting to others. Fortunately, the ReportGenerator project is simply excellent.
Running ReportGenerator is easy - you just give it the input files (with wildcard support) and point it to an output directory.
reportGenerator -reports:*.coverage.xml -targetdir:coverageThe wildcard support means that while I run xunit separately for each test assembly, all of those coverage results can be combined into a single report.
In my Psake build script, this becomes:
& $reportGeneratorExe -reports:$openCoverResultFolder\*.xml -targetdir:$openCoverReportFolderWith this in place, I just run integration-build.ps1, the project is built, unit tests are executed, integration tests are performed, documentation is generated from the Xml doc comments in the code, reports are generated for test results, and another report for test coverage. This takes just 2m 18s. In the future, this will be expanded by including compilatin of end user documentation, building an installer and publishing a deployment zip file.


