On my previous post on code coverage, someone asked if the coverage report could highlight areas where coverage decreased. It turns out that ReportGenerator can do this, but there’s room for improvement.
Activating history reporting is very simple - all you have to do is to add a -historydir option to the command line, specifying a folder that contains historical information about the project.
This history folder has to be a persistent location of some form - the contents need to remain intact between builds. There are a number of ways to achieve this. Some people choose to commit the files from this folder as a part of the repository, others use a shared network location, and some use a special folder on their continuous integration server that’s outside the normal workspace.
Here’s my amended report generation task:
Task Coverage.Report -Depends Requires.ReportGenerator,
        Configure.OpenCoverReportFolder, Coverage.Tests {

    exec {
        & $reportGeneratorExe -reports:$testResultsFolder\*.cover.xml
            -targetdir:$openCoverReportFolder
            -historydir:$baseDir\history\coverage
    }

    $openCoverIndex = resolve-path $openCoverReportFolder\index.htm
}
The eagle-eyed among you may also notice that this task no longer automatically opens the build report once generated. I’ve moved that into a separate task so that while the local build still automatically opens the report, the continuous integration build does not.
The history folder ends up with a collection of XML files, one for each report run, containing summary information about the build.
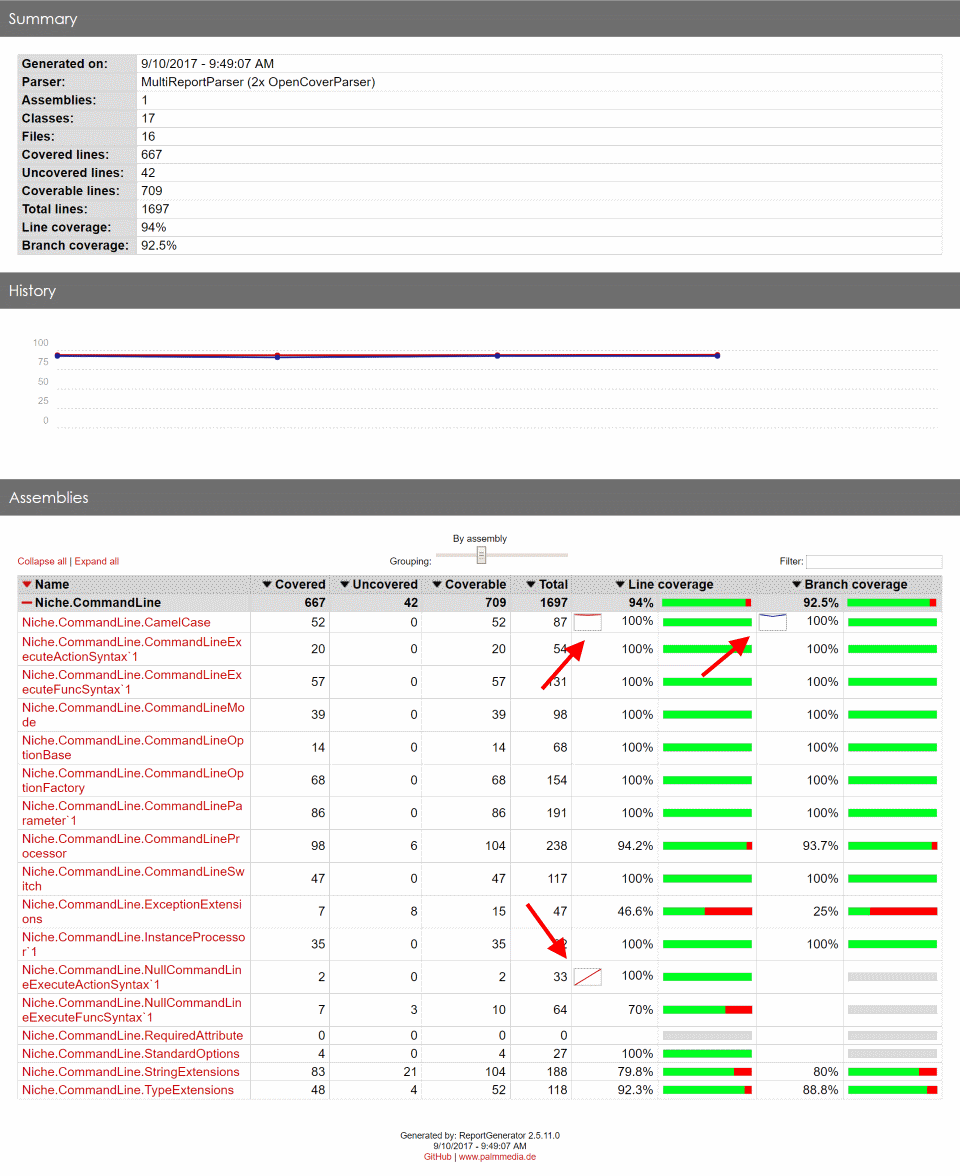
When the report is generated, the history is shown as a number of line graphs, showing changes in coverage over time. The front page includes both a summary graph at the top, as well as embedded graphs (a bit like sparklines) for each individual class:

I initially thought that the function wasn’t working because none of the classes had a sparkline showing. It appears that ReportGenerator smartly suppresses duplicate results when processing, and only generates a graph where the coverage changes over time. As soon as I made a change to my tests, a graph showed up next to the related classes.
Unfortunately, the history is relatively coarse, keeping information only about individual classes, no finer. There’s no history kept about individual methods, nor individual lines of code, so the reporting can’t identify lines that were once covered but are now not tested. This limitation is quite understandable, given the tradeoff between the high space requirements to store a detailed history and the lower value of the additional reporting.
That said, the graphs for each class are quite helpful and I wish I’d known about this feature when I first started using ReportGenerator for coverage reporting.


Comments
blog comments powered by Disqus