I have a concern about the amount of debris created on the heap by the enumeration technique we used last time. Let’s explore an alternative approach and see how that compares.
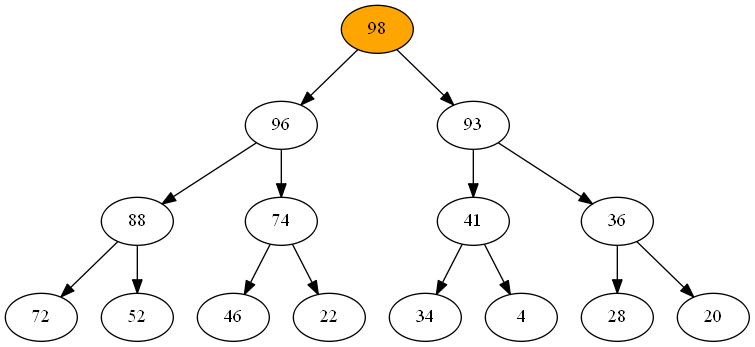
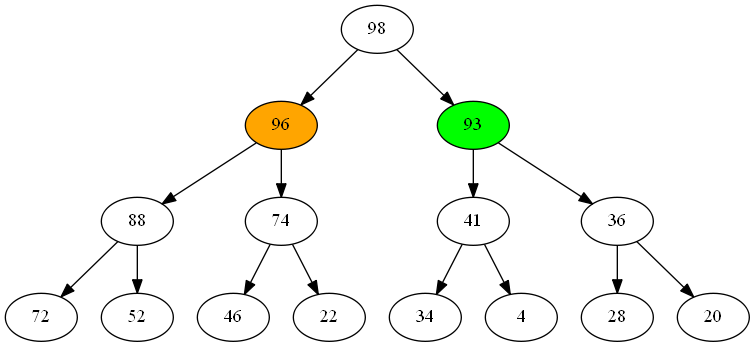
When we start iterating the content of a priority queue, choosing the first item to return from the queue is really easy - it’s the item at the head. The next item to return is found at the head of the left-hand subtree.


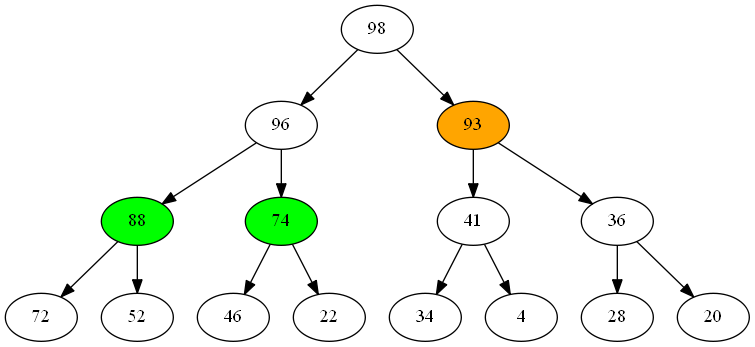
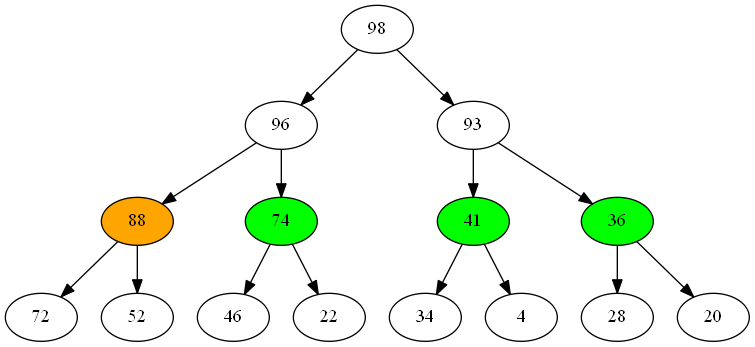
As we continue returning items (shown in orange), the pool of candidates for the next item grows (green), but only slowly.


This leads us to a useful observation about iteration - the number of potential next item values to return is limited to those that are immediate children of items we’ve already returned. All we need is some kind of way to organize those nodes by priority so we can return them in the right order.
Yes, that’s right - we can iterate this priority queue by using another priority queue!
Here’s the enumerator for working through a queue this way.
public IEnumerator<T> GetEnumerator()
{
    var queue = ImmutablePriorityQueue<IImmutablePriorityQueue<T>>.Create(
        (left, right) => _comparer(left.Head, right.Head));
    queue = queue.Enqueue(this);
The local queue contains a priority queue of priority queues, ordered by their head items, starting with our entire queue. We keep looping until the queue is empty.
    while (!queue.IsEmpty)
    {
        var head = queue.Head;
        queue = queue.Dequeue();
        yield return head.Head;
Each time around the loop, we return the item held on the front of the queue. Once that’s done, we add any children of that node into our queue for later processing.
        switch (head)
        {
            case DualItemImmutablePriorityQueue<T> dual:
                queue = queue.Enqueue(dual.Dequeue());
                break;

            case BranchingImmutablePriorityQueue<T> branch:
                queue = queue.Enqueue(branch._left)
                    .Enqueue(branch._right);
                break;
        }
    }
}
Our property tests confirm that this implementation works - but how does it perform?
My conjecture was that this approach would produce less debris on the the heap - lets do the test to confirm or refute this.
Using Benchmark.Net, we can set up a simple benchmarking test. Here’s the test fixture:
[MemoryDiagnoser]
public class Benchmarking
{
    private readonly IReadOnlyList<int> _raw;
    private readonly IImmutablePriorityQueue<int> _queue;

    public Benchmarking()
    {
        var generator = new Random(290272);

        _raw = Enumerable.Range(1, 10000)
            .Select(i => generator.Next(1000))
            .ToList();

        _queue = _raw.Aggregate(
            ImmutablePriorityQueue<int>.Create<int>(),
            (q, i) => q.Enqueue(i));
    }

    [Benchmark]
    public void MeasureHeap()
    {
        var sorted = _queue.ToList();
    }
}
In the constructor, we set up _raw as a list of numbers to add to the queue, then we add them all into _queue. We use a random number generator with a fixed seed so that we get the same list of values each time.
Running this test twice, once with each approach to enumeration, we get these results:
| Method | Mean | Error | StdDev | Gen 0/1k Op | Allocated Memory/Op |
|---|---|---|---|---|---|
| Simple | 5.763 ms | 0.1147 ms | 0.1126 ms | 992.1875 | 2.98 MB |
| Smart | 17.42 ms | 0.2310 ms | 0.2160 ms | 1781.2500 | 5.43 MB |
Surprisingly, the simple approach is by far the most performant - running almost 3x faster and using under half the memory of the complex version.
This is a really cool result, reinforcing the notion that it’s better to measure than guess.


Comments
blog comments powered by Disqus